
André Ourednik, BexArt 2010: windows in the trees, digital photography, 2011, reproduced under Creative Commons license: BY NC ND.
An epilogue to the domostatic episode.
The development of the inhabited space and its representations should be considered not within the scope of two or three centuries but on a millennial time-scale, with the amplitude of individual spatiality as the main observation variable. Two mutations have occurred in that scope, marking the beginning and the end of a period that I wish to call domostatic.
The first mutation takes places between 10’000 and 3’000 B.C., when a considerable part of humanity develops extensive cultual centers (e.g. Göbekli Tepe [Schmidt, 2005] or Çatal Hüyük [Jacobs, 1970; Farinelli, 2000]), whose need for infrastructure eventually converges with the development of agriculture, both of which lead to a generalization of a single-place spatial model of individual existence. Thereafter, for at least five thousand years, the relation of the human individual to space is realized through a dwelling (δόμος, domus, la demeure, das Heim), which unites all aspects of her life – from what we nowadays call the “private” life to her social function and political existence (if empowered to lead any). The link between the existence of the individual and her dwelling is so strong that individual identity comes to be thought of as co-extensive with this unique place. This even more so if the individual is confined to a subordinate social position. Particularly the existence of women, children or slaves is represented as being directly derived from that of the “house patriarch” (e.g. the paterfamilias in the Roman tradition) and comes to be considered as being realizable only within the walls of the dwelling. There are of course many exceptions to that model. Nevertheless, it can certainly be thought of as dominant during the domostatic period. To sum up the situation from the theoretical point of view of space, all individuals are thought of as being assignable to a single place. When talking of human populations, one does not ask “how” they are in space but “where” they are, thus implying that they always stay put.
A second mutation tears down this model, at least in practice. It is brought about by three technological revolutions occurring between the 18th and the 20th century. In first place by the introduction of manufactures, which triggers the separation of the place of residence and of work for an important part of the active population. Secondly, by the overcoming of what we have called a “metric condition of humanity” (Ourednik, Dessemontet, 2007): individuals — up to then bound in their everyday use to a space whose area never exceeds distances which can be traveled by foot — suddenly acquire the possibility to operate in much larger areas after the introduction of mechanic means of mass transportation, whose growth begins with the construction of the main railroad frame between 1848 and 1914. Lastly, means of tele-interaction put thousands of arbitrarily distant network nodes in the reach of any household, breaching its confinement from within.
These technological changes are parallel to the autonomization of individuals, notably of women [1], whose liberation from domostaticity can be considered as one of the most important historical leaps of the past century. Economic and social development allows (and sometimes forces) unprecedented individual mobility reflected for example in contemporary figures from the Swiss census [2]:
Distances traveled each day in average : 48 km
Distances traveled each year in average: 17’416 km (≈1/2 tour of the Earth)
Every time spent traveling each day in average: 86 min (6% of each day)
Average number of daily trips: 3.6
Average time spent each day outside of the residence commune: 197 min (weighted 206 min) (14% of each day)
The above figures, impressive enough, should be considered as underestimates. Though 86% of each day is still spent in the commune of residence, this time is not necessarily spent at home. In fact, at least 20% of stay-time in the residence commune is spent working or studying away from home. Added to this, at least 30% of each day is spent sleeping. This amounts to less than 36% “pure” active home-time, though “pure” only partly as a considerable time thereof is spent with means of tele-interaction. “Home”, recently still the very framework of individual identity, has definitely lost its past importance and the domostatic period should be considered as reaching its end.
Since the first permanent settlement communities in Mesopotamia, this period has lasted for five thousand years, which represents only 3% of the history of the homo sapiens [3]: a brief episode by all means, but too recent, still, to be really overcome in our way of thinking. And this intellectual overcoming, precisely, is also an unachieved performance of contemporary cartography.
Model inertia.
Though we have entered an age of generalized mobility, this major transition is usually not accounted for in classical thematic mapping, whose methodological base remains the statistical aggregation of mono-topical data in a domostatic perspective. In this perspective, individuals’ spatiality is still reduced to its static residential dimension.
In large part, this is certainly due to an inertial momentum in our way of conceiving statistical models. An example thereof is the above-mentioned archaic notion of the “head of household” (chef de ménage, Haushaltsvorstand) still in use in the census apparatus of many modern countries. My hypothesis, however, is that this state of affairs is also due to a lack of synthetic tools capable of rendering movement of large populations in easily readable maps. This lack contributes to model inertia and constitutes both a heuristic and a practical issue, as it prevents us to fully understand the articulation between movement and place, thus impeding also correct decisions pertaining to urban and territorial development.
Overcoming the domostatic reduction by integrating the temporal dimension of spatial existence into visual models.
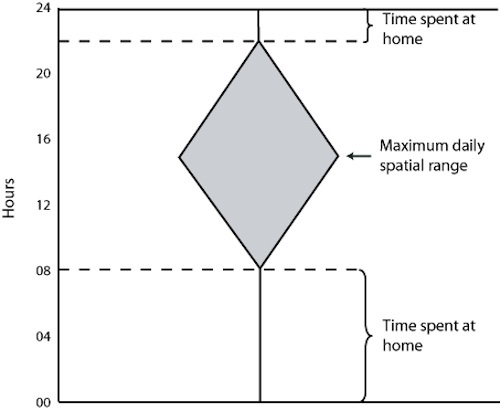
Figure 1. Space-time diagram (adapted from Hägerstrand, 1970).
The question is, thus, how to overcome what I wish to call the domostatic reduction by integrating the time-dimension of human beings in thematic mapping. An early solution to this problem has been adopted by Hägerstrand (1970) and Lenntorp (1976). It consists in representing geographical phenomena in the same manner as any physical process, i.e., by using one dimension of the classical Euclidian model-space to represent time (Figure 1). In a strict sense, this choice is questionable as such a semantic spatialization of time suggests a time-reversibility which does not apply to human affairs. In all other respects, however, the space-time diagram solution is highly efficient where it comes to knowing the position of an individual, in space, at a given time. Its use has notably given birth to the notion of the “pocket of local order” (Hägerstrand 1985): an excellent tool for understanding the social impact of spatial friction and the interplay between localized action and mobility in social interactions.
Nevertheless, though efficient in rendering space-time paths of small groups of individuals, this treatment of time as a dimension of cartographic space reaches its limit when it comes to the representation of larger populations. This limitation has not been overcome, neither by the recent introduction of 3D spatial diagrams (see an example in Figure 2), nor by the use of cinematic effects in multimedia mapping or algorithmic simulation (Figure 3). These computer-reliant methods do, of course, supersede the necessity to reduce the topographic space to one dimension (cf. Figure 2) but they do not allow for an efficient evaluation of the relative importance of places in terms of the intensity of their practice by human populations.
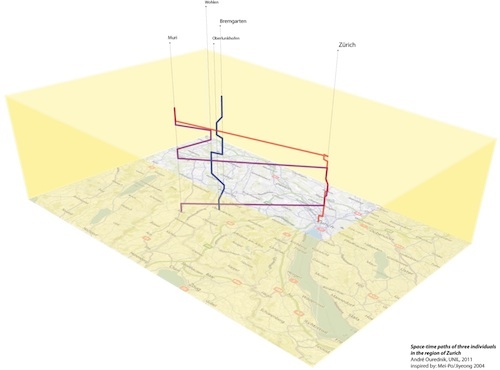
Figure 2: A 3D space-time diagram, showing 24h paths of three individuals in the region of Zurich (figure by Ourednik, inspired by Mei-Po/Jiyeong 2004).
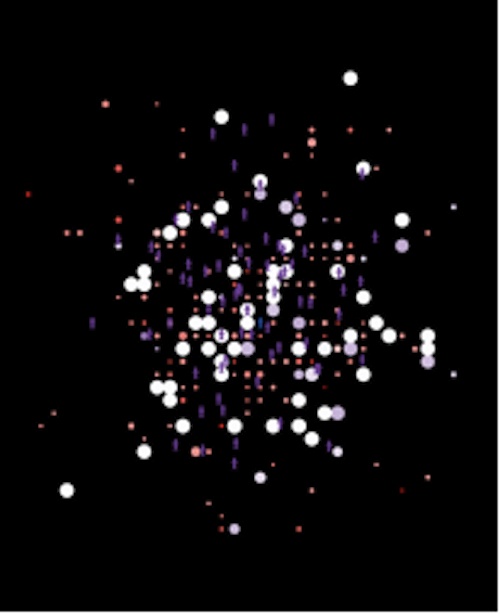
Figure 3: Multi-agent modeling for the integration of the time dimension of individuals’ geographic existence.
“How to bring the world on a sheet of paper?”
These limitations of multimedia- and 3D-mapping bring us back to the problem of reducing the lived space to a synthetic representation able to account for large populations of mobile individuals. Its solution is obviously not to be found in further development of computer hardware but in the right way of asking the cartographic question. This, in turn, can be done by bringing back to our mind the fundamental task of science, excellently stated by Bruno Latour:
Il n’y a rien que l’homme soit capable de vraiment dominer: tout est tout de suite trop grand ou trop petit pour lui, trop mélangé ou composé de couches successives qui dissimulent au regard ce qu’il voudrait observer. Si ! Pourtant, une chose et une seule se domine du regard : c’est une feuille de papier étalée sur une table ou punaisée sur un mur. L’histoire des sciences et techniques est pour une large part celle des ruses permettant d’amener le monde sur cette surface de papier. Alors, oui, l’esprit le domine et le voit. Rien ne peut se cacher, s’obscurcir, se dissimuler. (Latour, 1985)
In this perspective, we can make the task of overcoming the domostatic reduction of the inhabited space more precise: this overcoming has to be done without losing the ability to produce, synthetic, easily readable maps. In other words, the right question to ask in thematic mapping, as in any other scientific procedure is « how to bring the world of mobile individuals on a sheet of paper? ».
Towards the concept of total stay-time.
Once the right question is asked, the step from time-geography’s space-time diagrams to a synthetic 2D representation of the inhabited space is relatively simple to achieve, at least from the formal point of view. Basically, it can be done by projecting time on the two purely spatial dimensions of a map, i.e., by a simple summing operation of all the time-segments spent by individuals in every place.
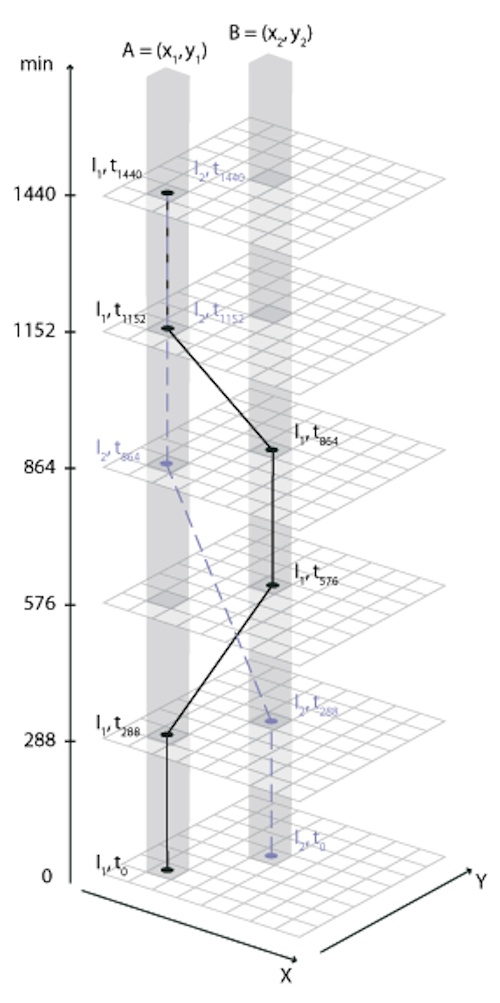
Figure 4: Summing up stay-times (Ourednik).
One can take the example of Figure 4, which shows the spatiotemporal paths of two individuals (I1 and I2) in the span of a day (1440 minutes). The time spent in place A is 576 min by I1 and 576 min by I2, giving a total of 1152 min. Time spent in place B is 288 min by I1 and 288 min by I2 giving a total of 576 min. We can also say that 576 min, which cannot be attributed to any place, have been spent in transportation means between A and B (288 min by I1 and 576 min by I2).
As large sums of minutes lack the expressive power of standard population counts, they should be converted back to a number of individuals. To do so, we can first note that the permanent stay of one individual in a place is equivalent to 1440 minutes if the considered time-scale is that of a day. Thus, we can say that the population of place A is equivalent to a permanent stay of 0.8 individuals (1152/1440) and that the population of place B is 0.4 (576/1440).
Of course, what must be conceptually achieved in order to produce such statements is abandoning the concept of a population of individuals in favor of the concept of a total stay-time, measured for example in lived days or in lived years. This implies getting rid of a singularistic and substratic perception of the individual, whose conceptual base is provided by Greek atomism (Leucippus, Democritus etc.) and which has been strongly anchored in the heart of the human sciences ever since Hobbes (1651). It also implies, of course, the overcoming of domostatic ideology (cf. above).
The conceptual framework for this step is provided in the first place by such phenomenological approaches as the theory of inhabitation (Wohnen, habiter) (Heidegger, 1954; Lefebvre, 1968) or that of the lived space (Bollnow, 1963). These theories allow us to transfer our attention from individuals to phenomena as such, i.e., to the set of unique place & individual conjunctions. A second type of theories reveals the plurality of the contexts of individual action [4] (Boltanski, 1990; Thévenot, 1990; Fuhrer, Kaiser, 1994) and of the individual herself (Lahire, 1998). Combined with each other and with the formal approach of spatial statistics, these theoretical frameworks allow us to divide the individual up and to “distribute” her existence to a plurality of places. We achieve, thus, a conceptual respect of the individual by giving up the idea of her indivisibility.
Mapping mobile individuals in a common inhabited space.
According to Olsson (1994), “man is a semiotic animal, a species whose individuals are kept together and apart by their use of signs”. In any age, a community of individuals exists only insofar as it is capable of producing a synthetic image of itself. In an age of general and diversified mobility, such an image can only be realized insofar as the time-dimension of the individuals who make up contemporary communities is taken into account. Distributing individual stay-times over a plurality of places is one of the necessary steps towards this goal. Its achievement gives any contemporary community the necessary theoretical tools to avoid domostatic regression without renouncing to the formulation of common projects.
Comparing real and domostatic populations of places.
One of the interesting practical uses of the concept of total stay-time can be demonstrated by comparing it to domostatically measured populations. A difficulty in this respect is that person counts have to be compared to total stay-times expressed in person-days or person-years. This means that we are not dealing with the same units. The adaptation, though, is not difficult: we only have to consider standard person counts as what they really are, i.e., as total stay-times calculated under the assumption of the immobility of all individuals. Populations under this domostatic assumption (ΣH) can then be compared to stay-times calculated with regard to individual mobility (ΣT).
En example of the difference between both measures can be observed in Figure 5. ΣT/ΣH has been calculated for the cities of Geneva and Zurich, at hectometric precision. As one can see, there can be up to 1000 times as much real stay-time then what the domostatic assumption would allow to think. The greatest difference can be observed in the city centers, which draw great amounts of stay-time from the surroundings.
This result is not unexpected but thanks to this map, one is able to assess more precisely how much more populated these centers are in comparison to their residential populations. One can easily understand what weight this type of maps can have in a political debate concerning the distribution of public resources between urban and suburban areas. For example, while a domostatic perspective would allow suburban residents to consider that their taxes should only be invested in their communes, the stay-time maps show very clearly why city centers could raise a legitimate claim for at least a part of suburban tax revenue, as they provide a social and a technological infrastructure for a much larger population than “their own”.
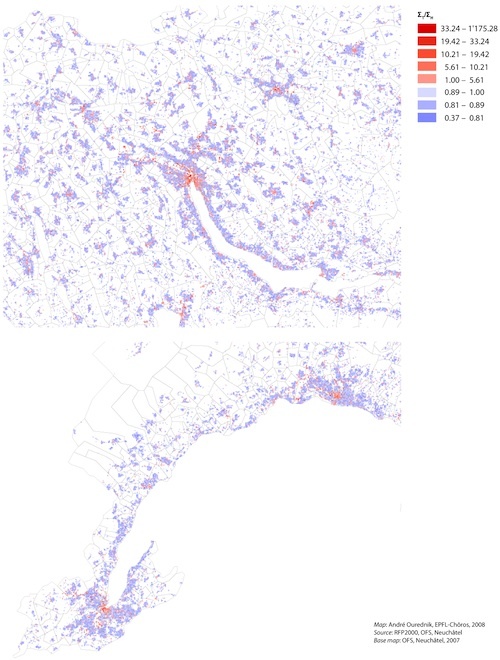
Figure 5: Ratio ΣT/ΣH between real and democratically measured population for the metropolitan regions of Zürich and Genève-Lausanne (Ourednik, EPFL-Chôros, 2008).
No place is local.
But who are, in fact, the inhabitants of a place? In regard to this question, leaving the domostatic perspective is to geography like opening Pandora’s Box, as no one stands still anymore. All objects of any concern to the discipline must then be understood in a dynamic relationship to the rest of the geographic world. Because any spatially defined area in today’s globalized context is actually inhabited by more people than those that reside in this area, all individuals on the planet can be considered as a potential part of the population of any place. In other words, no place is local.
From a broad geographical perspective, this reality questions the whole westphalian model of the territorial state. If we reduce our consideration to a purely cartographic perspective, we must admit that a population map of any territory can only strive for accuracy if one tries to include global-mobility-induced stay-times within the mapped area.
To what extent this is true can be verified on Figures 6 and 7, which show “imported” stay-times by non-residents in the Swiss communes. These stay-times appear if one considers the statistics of hotel nights or trans-border commuters. The touristic presence, in particular, can sometimes up to triple the local population at the commune level (Figure 6), which shows not only the inaccuracy of domostatic measuring but raises also major political questions about “local” governance. In effect, to what extent can a commune in which only one third of the inhabitants has political rights and obligations be considered as democratic?
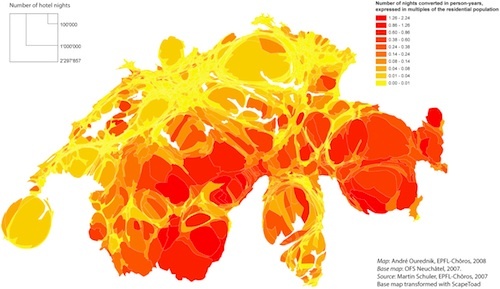
Figure 6: Hotel nights in the Swiss communes in 2000. Commune sizes show the total number of nights. In the shades of red is the proportion of the “imported” lived years by hotel visitors in comparison with those of the resident “autochthones” (Ourednik, EPFL-Chôros, 2008).
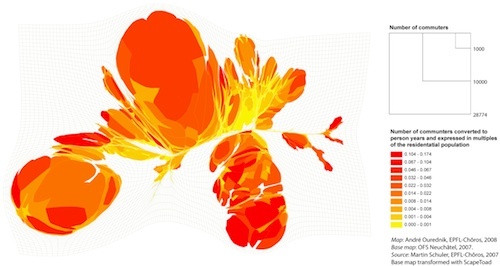
Figure 7: Trans-border commuters working in Switzerland during the year 2000 (Ourednik, EPFL-Chôros, 2008).
Though the overcoming of the domostatic perspective shall inevitably raise many more such considerations in future geography, one of the great advantages of the concept of total stay-time is allowing for a combination of all identified allochtoon stay-times into a synthetic map. In Figure 8, all data on working, residential, touristic and trans-border commuting stay-times already accounted for in Figures 4, 5 and 6 are summed up in such a manner. As one can see, this sum reveals the stay-time importance of both the urban centers and the touristic regions, very underestimated in traditional population maps.
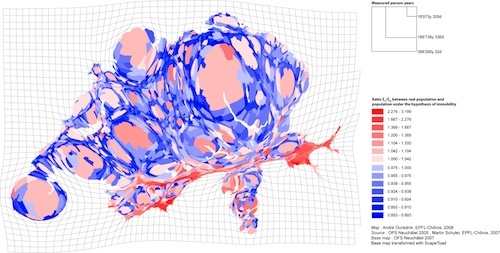
Figure 8: Total stay-times in the Swiss communes and the ratio ΣT/ΣH between these and the residential population count. Residents, workers, students, tourists and trans-border commuters in the year 2000 combined (Ourednik, EPFL-Chôros, 2008).
No map can show real movement.
Of course, there is still something that can be held against the method shown so far: the reduction of the diachronic dimension of individuals to a simple displacement in predefined spatial ontologies. From the point of view of many thinkers, in effect, there is more to movement than mere displacement within a defined space. Bergson (1923), for example, has shown why real movement cannot be represented in any spatial model of reality, as the temporal dimension ultimately implies ontological transformation [5]. As another major thinker puts it: “Das Fremde ist nicht einfach anderswo, es ist das Anderswo“ (Waldenfels, 1997). Existential movement into the unknown cannot be mapped into an already defined representation space.
To take this aspect into account, spatial models of true movement would have to include their own “overcoming”.
Mapping desire.
Our hope to see a self-overcoming map, someday, is relatively low. In the meantime, though, there is no need to limit our consideration of the time-dimension of the individual to her performed trips. In effect, movement, even as simple displacement within static ontologies, also consists of a motive, thus of a teleological projection. And because ontological categories are commonly shared operators of expressed choice, the projective dimension of individuals can be brought on the same plane of co-existence. In other words, projectiveness itself can also be mapped, for entire populations of individuals.
This is exactly what has been done to produce the Figures 9, 10 and 11, where I have considered the intention of individuals to live in a more or less urban space. More precisely, the individuals [6] have been asked in what type of place they wish to reside. The six possible choices and the frequency of the answers in favor of each choice are shown on Figure 9.
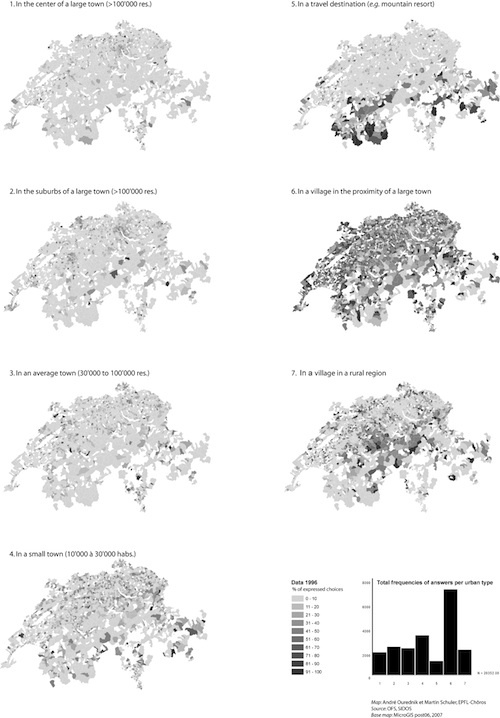
Figure 9: Where do Swiss young men want to live? Total (histogram) and spatially distributed frequency of answers in favor of each possible choice (Ourednki, Schuler, EPFL-Chôros).
Figure 10 shows the perceived urban type of the current residential place of each individual. As the six possible choices range between a “center of a large city” to a “village in a rural region”, the answers can be considered as giving ordered values representing a “degree of urbaneness”. It is thus possible to calculate a median and a mean for each place [7].
Figure 11, finally, allows us to compare between the desired and the current residential environment. To do so, an indicator of a total balance of urbaneness desire [8] has been defined. It sums up the wishes of all individuals in a place for more or for less urbaneness.
What do these Figures reveal? First, the striking proportion of young Swiss men’s desire to live in a “village in the proximity of a large town” [9] (see histogram in Figure 9) — a real “ontological” problem as it seems difficult to conceive a territory that would answer to this desire… Second, an important rejection-tendency of urbaneness in the most populated areas, compensated by a desire for more urbaneness in the smaller ones. As I have shown elsewhere, these opposite desires combine into an overall national tendency towards development of middle-sized towns (3) and dense urban centers (1), whose populations would increase by 3.6% and 2.5% respectively if all desires were translated into action, as reveals the first level product of the Markov transition matrix (Ourednik, 2010, pp. 409-410).
From a purely cartographic perspective (which is our main point of concern here), one should see figures 9 through 11 above all as a proof of the possibility to map the subjective facet of individuals’ being-in-space in a space shared by a large population of individuals. Figure 10, for instance, gives us the ability to assess the gradients of urbaneness as perceived by individuals, and not as indicators calculated by an “external” observer. This in a formal way but much unlike traditional thematic maps which usually heavily rely on such indicators. We are switching from a top-down to a bottom-up observation of urbaneness. Figure 11 goes even beyond this possibility, showing a common space of individual projects.
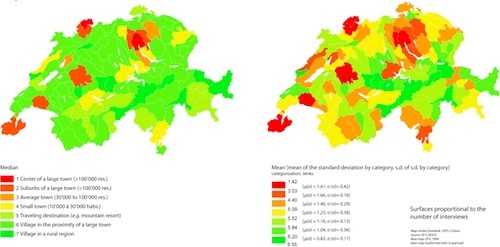
Figure 10: The perceived degree of urbaneness of one’s own residential place. N.B.: As we are not dealing with metric bur with ordinal values, the mean should not be over-interpreted (Ourednik, EPFL-Chôros).
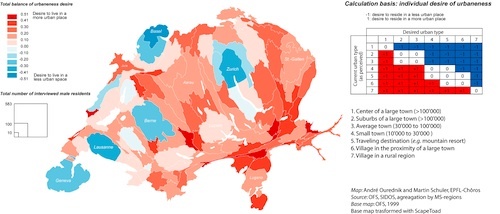
Figure 11: Total balance of urbaneness desire of young Swiss men. Insert: calculation basis for the indicator. As we are not working with metric but with ordinal data, please note that it is assumed that there is no difference between urban types 2 and 3, 4 and 5 or 5 and 6 (Ourednik, Schuler, EPFL-Chôros).
Semantic issues of showing movement.
In this paper, the main issue in mapping the diachronic reality of the inhabited space was the definition of non-domostatic indicators. I have used standard raster-vector maps and, following contemporary common practice in population mapping, density-equalizing anamorphosis [10] to represent the values obtained for these indicators. Even when measuring place-population in total stay-times, though, map metrics and topologies must be adapted to the questions we wish to ask, to the discourse we wish to make about the mapped space, and to the target audience of our maps. Before coming to a conclusion, therefore, I would like to question the pertinence of the use of anamorphic cartograms with regard to mobility.
We must first remember that the very aim of contiguous anamorphic cartograms is to alter polygon areas while conserving the topology and the orientation of an original representation, usually a topographic one. Thus, cartograms remain to a large extent caught in a topographic logic. This logic is as inappropriate to the contemporary reality of mobility as domostatic population indicators, and this for the simple reason that mobility is never as much constrained by the topographical relations between places as by the existence of a transportation network which link them.
A possible remedy to this problem can be to superimpose the transportation network to the anamorphic map, as has been done in Figure 12. Up to recently, such a superposition implied a major technical difficulty but we have been able to overcome this problem with the ScapeToad software (Kaiser, Ourednik, 2009).
To go further, though, we can totally abandon topographical relations between places to concentrate on what is important: masses of stay-time and the relations between these masses by the means of the transportation network. This is what has led to the result presented on Figure 13.
However, if we are interested in actualized mobility, even this map is still insufficient, for two reasons. First, it shows only the potentials offered by the existing transportation infrastructure. As such, the map doesn’t show actual mobility and even less so individual’s desire of movement. The latter, in particular, would be important to show in order to guide infrastructure development according to those desires and not vice versa. Second, the metric of the map on Figure 13 doesn’t show the time involved in moving from one place to another, i.e., the most important information concerning place-relations.
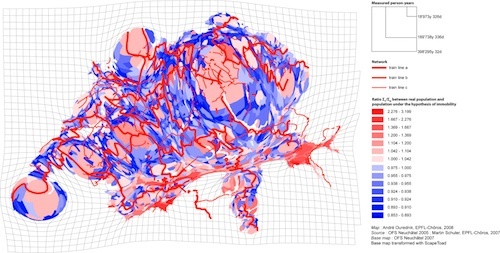
Figure 12: Total stay-time in the Swiss communes, with the superimposed railway network (Ourednik, EPFL-Chôros, 2008).
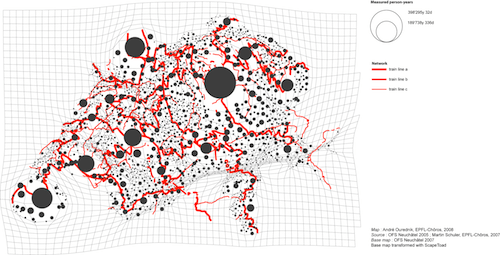
Figure 13: Total stay-time in the Swiss communes. Masses of stay-time and their mobility relations (Ourednik, EPFL-Chôros, 2008).
Facing these lacks, it seems that the only way to privilege individual actions and intentions over a pre-existing spatial structure is to build the map in a bottom up fashion. This is precisely what has been done by the SCALAB team (2004), as illustrates Figure 14 for one individual. This very interesting solution, however, leads us back to our starting point: as illustrates Figure 15, where several individual spaces are shown, mapping whole populations of mobile individuals becomes as difficult as it were in the solutions proposed by time geography. Thus the question remains: How can we articulate stay-times and displacement times in a bottom up, synthetic and easily readable map? Its answer will certainly imply much further research on the integration of both time and space in 2D maps.
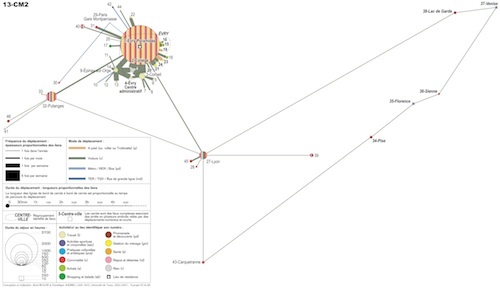
Figure 14: The question is: how to do this bottom up. (Scalab, 2004. Reproduced with the ex-gratia permission of Boris Beaude).
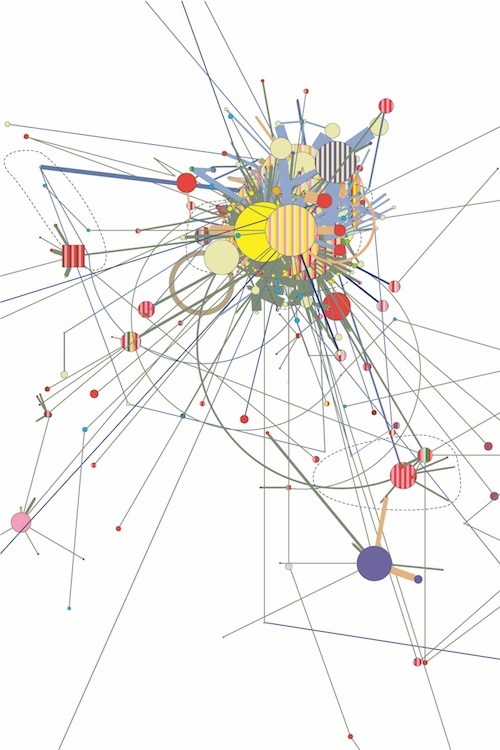
Figure 15: A sample of individuals residing in Paris. Reality still appears very complex when all individuals are put on the same map. (Source: Scalab, 2004. Reproduced with the ex-gratia permission of Boris Beaude).
Despite the yet unsolved difficulties of their graphic representation, such indicators as total stay-time or the total balance of urbaneness desire allow us to overcome the domostatic confinement of the individual, thus liberating population measurement methods from an archaic ideology. They are certainly only two examples of a whole new set of geographical indicators which have to emerge now that the individual has been unfolded into her time and the places into their surrounding world.
The reflections “behind the scenes” of the construction of such indicators have sometimes been criticized as too elaborate for the use of a general public, but what I have tried to do here is to reveal these reflections with as much precision as needed in a scientific context. Thanks to the comparability of a total stay-time expressed in person-days or person-years to a standard person count, I have no doubts about the ability of the general public to interpret this indicator. The same applies to the total balance of urbaneness desire, who can, even without clearly understanding the insides of its calculation, be read as a simple wish for more or for less urbaneness, expressed by the population of a place. My hope is that future maps conceived upon these new indicators will contribute to the political debate on spatial justice and management.
Unless otherwise stated, all other figures are the work of André Ourednik. They are reproduced under the Creative Commons license BY NC ND.
